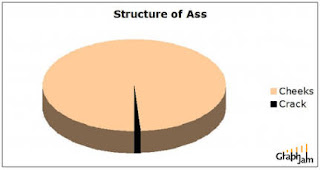
A pie chart is a round graph divided into sectors that illustrates percentages of a whole. It is named after the way we normally divide a pie into slices. Whether it is effective depends on the type of data you want to present. What really matters is whether you can make it funny!
read more | digg story

No comments:
Post a Comment